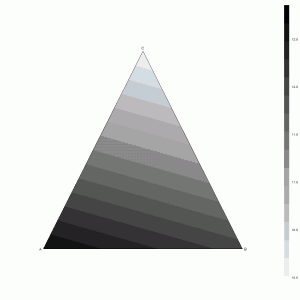
In mixture experiments there is a constraint that the variables are the proportions of components that are mixed together with the consequence that these proportions sum to one. When fitting regression models to data from mixture experiments we may be interested in reprenting the fitted model with a surface plot.
The constraint on proportions means that the mixture data can be described in one dimension lower than the total number of components. For example when there are three mixture components a two dimension plot can be used to represent the mixture within an equilateral triangle.
To create a surface within the mixture triangle we can create a grid of points and then convert these pairs of points into mixture triples.
mygrid = rbind( expand.grid( x = seq(0, 1.0, length.out = 500), y = seq(0, sqrt(3)/2, length.out = 500) ) ) |
The conversion formulae are shown below:
mygrid$a = (sqrt(3) * (mygrid$x - 0.5) + (mygrid$y - 0.5 * sqrt(3))) / (- sqrt(3) - 0.5 * sqrt(3)) mygrid$b = (- sqrt(3) * (mygrid$x - 0.5) + (mygrid$y - 0.5 * sqrt(3))) / (- sqrt(3) - 0.5 * sqrt(3)) mygrid$c = 1 - mygrid$a - mygrid$b |
The next step is to calculate our surface values, a trivial example of which is:
mygrid$z = 10 + 4 * mygrid$a + 3 * mygrid$b |
We then need to trick the plotting function by setting all invalid mixture combinations to be missing values.
mygrid$z[mygrid$a < 0 | mygrid$b < 0 | mygrid$c < 0] = NA mygrid$z[mygrid$a > 1 | mygrid$b > 1 | mygrid$c > 1] = NA |
Lastly we use the levelplot function in the lattice package.
trellis.par.set("axis.line",list(col=NA,lty=1,lwd=1))
levelplot(z ~ x*y, data = mygrid,
	col.regions = gray(101:0/101), scales = list(draw=FALSE),
	xlab = "", ylab = "",
	panel = function(x, y, z, ...)
	{
		panel.levelplot(x, y, z, ...)
		panel.lines(c(0,1), c(0,0), col = "black")
		panel.lines(c(0,0.5), c(0,sqrt(3)/2), col = "black")
		panel.lines(c(0.5,1), c(sqrt(3)/2,0), col = "black")
		panel.text(0.5, sqrt(3)/2, "C", pos=3)
		panel.text(0, 0, "A", pos=2)
		panel.text(1, 0, "B", pos=4)
	},
	xlim = c(-0.2,1.2),
	ylim = c(-0.2, 0.2+sqrt(3)/2)
) |
This forms the basis of a ternary surface plot and various adjustments can be easily made to customise the plot.
Other useful resources are provided on the Supplementary Material page.


I would like to know how to draw arrows on the top of the levelplot.
arrows(x0=.5, y0=.5, x1=.5, y1=1, code=3)
segments(x0=.5, y0=.5, x1=.5, y1=1)
It displays error messages of “plot.new has not been called yet”
I guess the arrows function is not applicable to levelplot.
Off the top of my head there are panel equivalents for lattice graphics. So you would need to define your own panel function and add the appropriate calls into that function. If you run help(xyplot) there are examples of writing your own panel function that might get you up and running.
As this example is using the lattice graphics package you will need to edit the panel function from the above example. There should be equivalents to arrows and segments which are likely to be panel.arrows and panel.segments.
Hope this helps you get your example working.
Thank you a lot, it was helpful